Skip to content
Custom DashboardsYour Weave workspace

Your data.
Your view.

Compose the dashboard you actually need from any chart in Weave, or ask for one in plain English.

Available on every Weave plan.

Engineering pulse

Search Weave
IntervalWeekDatelast 3 months

Code output

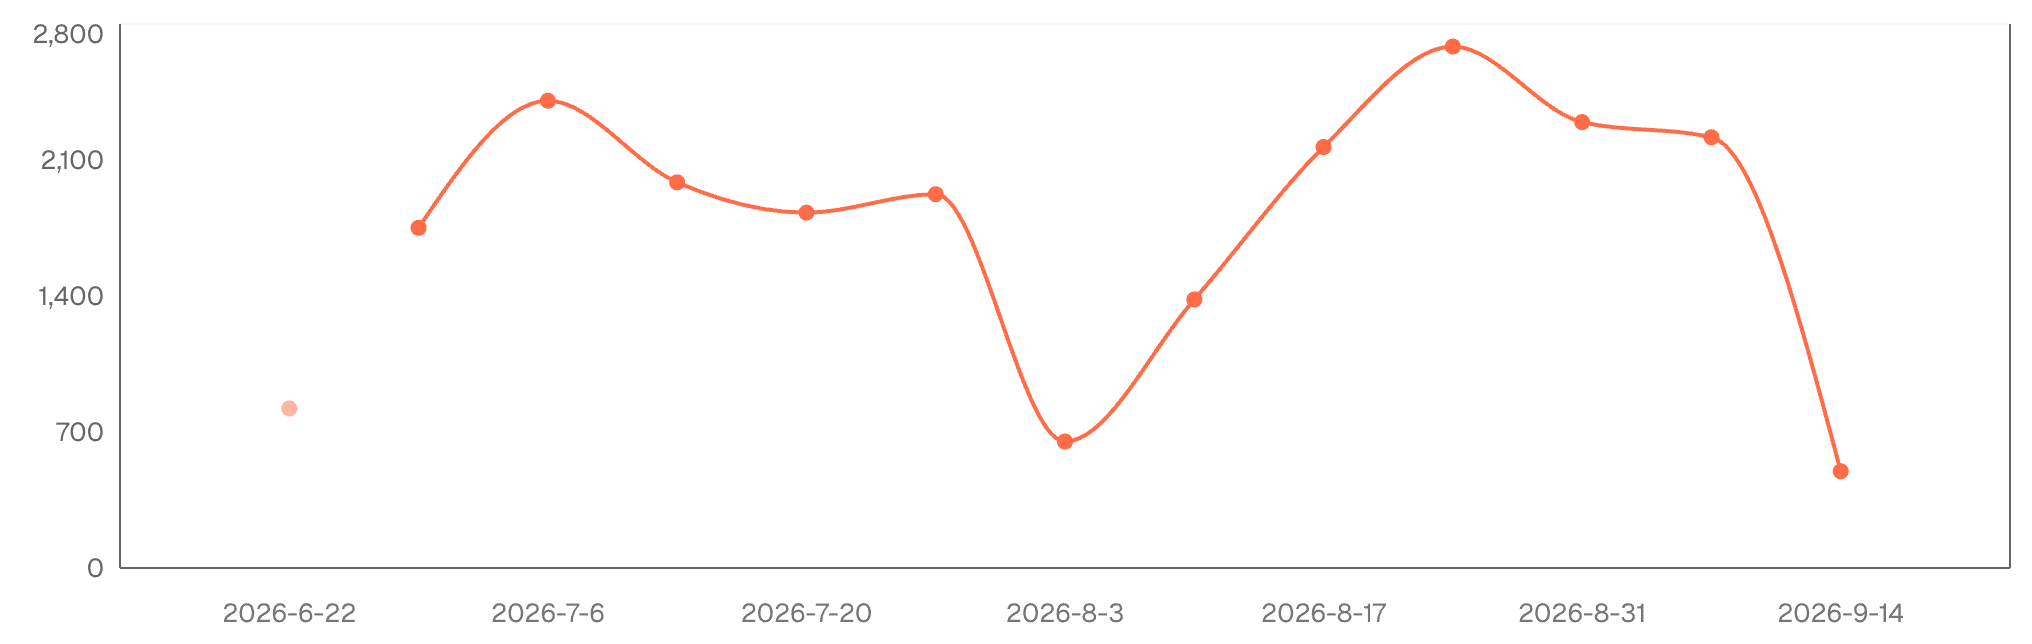
1,701.8/week
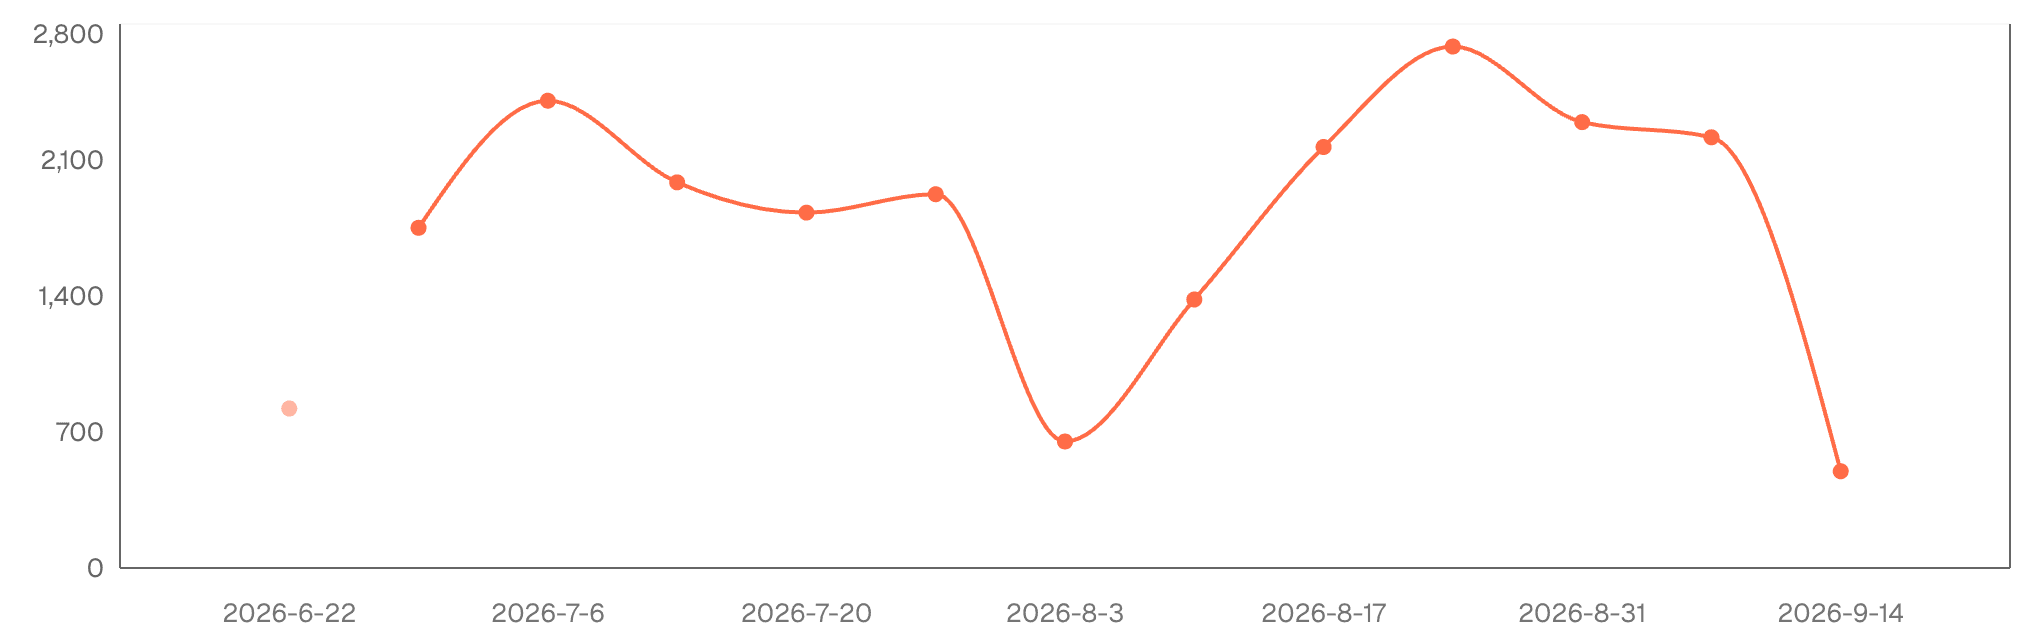
Code output line chart, June 22 to September 14, 2026, with a vertical scale from 0 to 2,800.

Code output per engineer

1,739.2/week

Code output per engineer line chart, June 22 to September 14, 2026, with a vertical scale from 0 to 2,800.
A home for the questions that matter. Collect any chart Ask in plain English Make it yours
01 / Your workspace, your way

Everything you need.
Nothing to hunt for.

Custom queries

Ask for a chart that
doesn’t exist yet.

Describe your question in plain English. Keep the chart that answers it.

Your chart collection

Add any chart.
From anywhere in Weave.

AI usage, output, costs, anomalies, DORA. Collect the views you come back to.

Built for the whole org.
Filtered for you.

One shared dashboard. Each person’s filters stay theirs and are waiting when they come back.

IntervalWeekDatelast 3 months
Your view, remembered.

Share it.
Or keep it yours.

Org dashboards for everyone; personal ones for you. Resize and rearrange any widget. Rename your dashboard as the questions change.

Book a Demo
Built around your questions

One for the board.
One for the work.

Start with an executive view. Go deeper where your team needs it.

Executive

The big picture, ready to share.

Org-level output, adoption, and delivery metrics for the leadership meeting and the board deck.

AI cost & efficiency

See what the investment delivers.

Spend by tool and model, cost per output, and adoption over time. One view of the AI investment.

Your team’s view

Answer the question you keep getting.

Output by tool, location, or role. A focused dashboard for the decisions your team makes every week.

Designed around your data

More answers.
The right boundaries.

Your organization’s snapshot.

Queries run against a snapshot of your org’s data, never against production.

Read-only. Validated first.

Queries are parsed and validated. Prompts, messages, and email content are never queryable.

Checked before you see it.

The agent reads its own errors and retries before returning a result.

Less searching. More understanding.

Your next question
deserves a better view.

Custom Dashboards are available on every Weave plan. Build one from the charts you already use.

A place for everything.
A view that’s yours.
Wooly mascot